Code
#pkg
library(tidyverse)
library(readxl)
library(patchwork)

# src
source(here::here("src/function/stat_function/stat_analysis_main.R")) # for make plot 
source(here::here("src/function/fig_export.R")) # This function saves a given plot (plot_x) as both a PDF and a high-resolution PNG file at specified dimensions.

# cosmetics
sulfate_pallet=read_excel(here::here("data/color_palette.xlsm")) %>%
      filter(set == "sulfure_condition") %>%
      dplyr::select(color, treatment) %>%
      pull(color) %>%
      setNames(read_excel(here::here("data/color_palette.xlsm")) %>%
                 filter(set == "sulfure_condition") %>%
                 pull(treatment)
               )

mutant_palette=read_excel(here::here("data/color_palette.xlsm")) %>%
      filter(set == "mutant") %>%
      dplyr::select(color, treatment) %>%
      pull(color) %>%
      setNames(read_excel(here::here("data/color_palette.xlsm")) %>%
                 filter(set == "mutant") %>%
                 pull(treatment)
               )

my_color_palette <- read_excel(here::here("data/color_palette.xlsm"))

18.1 Data importation

Code
# 1. Table de correspondance « nettoyée » : un seul Psat (le plus grand) par PsCam
mapping <- read_excel(
  here::here("data/microarray/Resultats_4plex-POIS-2014_01_230415_modKG.xlsx"),
  sheet = "Pscam_to_Psat_v1c_mrna_besthit-",
  col_types = c("text", "text", "numeric", "numeric")   # attention à "numeric"
) %>% 
  select(PsCam, Psat) %>% 
  mutate(                             # extrait la partie numérique de Psat
    psat_num = as.integer(str_extract(Psat, "\\d+"))
  ) %>% 
  arrange(PsCam, desc(psat_num)) %>%  # trie du plus grand au plus petit
  distinct(PsCam, .keep_all = TRUE) %>% 
  select(-psat_num)                   # on n’a plus besoin de la colonne intermédiaire

# 2. Ton tableau principal
df_qpcr <- read_excel(here::here("data/qpcr/qPCR_myriam.xlsx")) %>% 
  mutate(
    # 1. condition sulfate : S+ → SS | S‑ → SD
    sulfur_condition = if_else(str_detect(plant_id, "^S\\+"), "SS", "SD"),

    # 2. génotype (4 chiffres juste après S+ ou S‑)
    allele          = str_extract(plant_id, "(?<=^S[+-])[0-9]{4}"),

    # 3. type de génotype : WT si “wt”, sinon Mut
    type_genotype   = if_else(str_detect(str_to_lower(plant_id), "wt"), "WT", "Mut"),

    # 4. numéro de plante
    plant_num       = str_extract(plant_id, "(?<=\\d{4}-)\\d+") |> as.integer(),

    genotype = case_when(
      allele == "4693" & type_genotype == "Mut" ~ "E568K",
      allele == "4693" & type_genotype == "WT"  ~ "WT2",
      allele == "2684" & type_genotype == "Mut" ~ "W78*",
      TRUE                                      ~ "WT1"
    )
  ) %>% 
  left_join(mapping, by = "PsCam")

write_csv(df_qpcr, here::here("data/qpcr/output/qPCR.csv"))
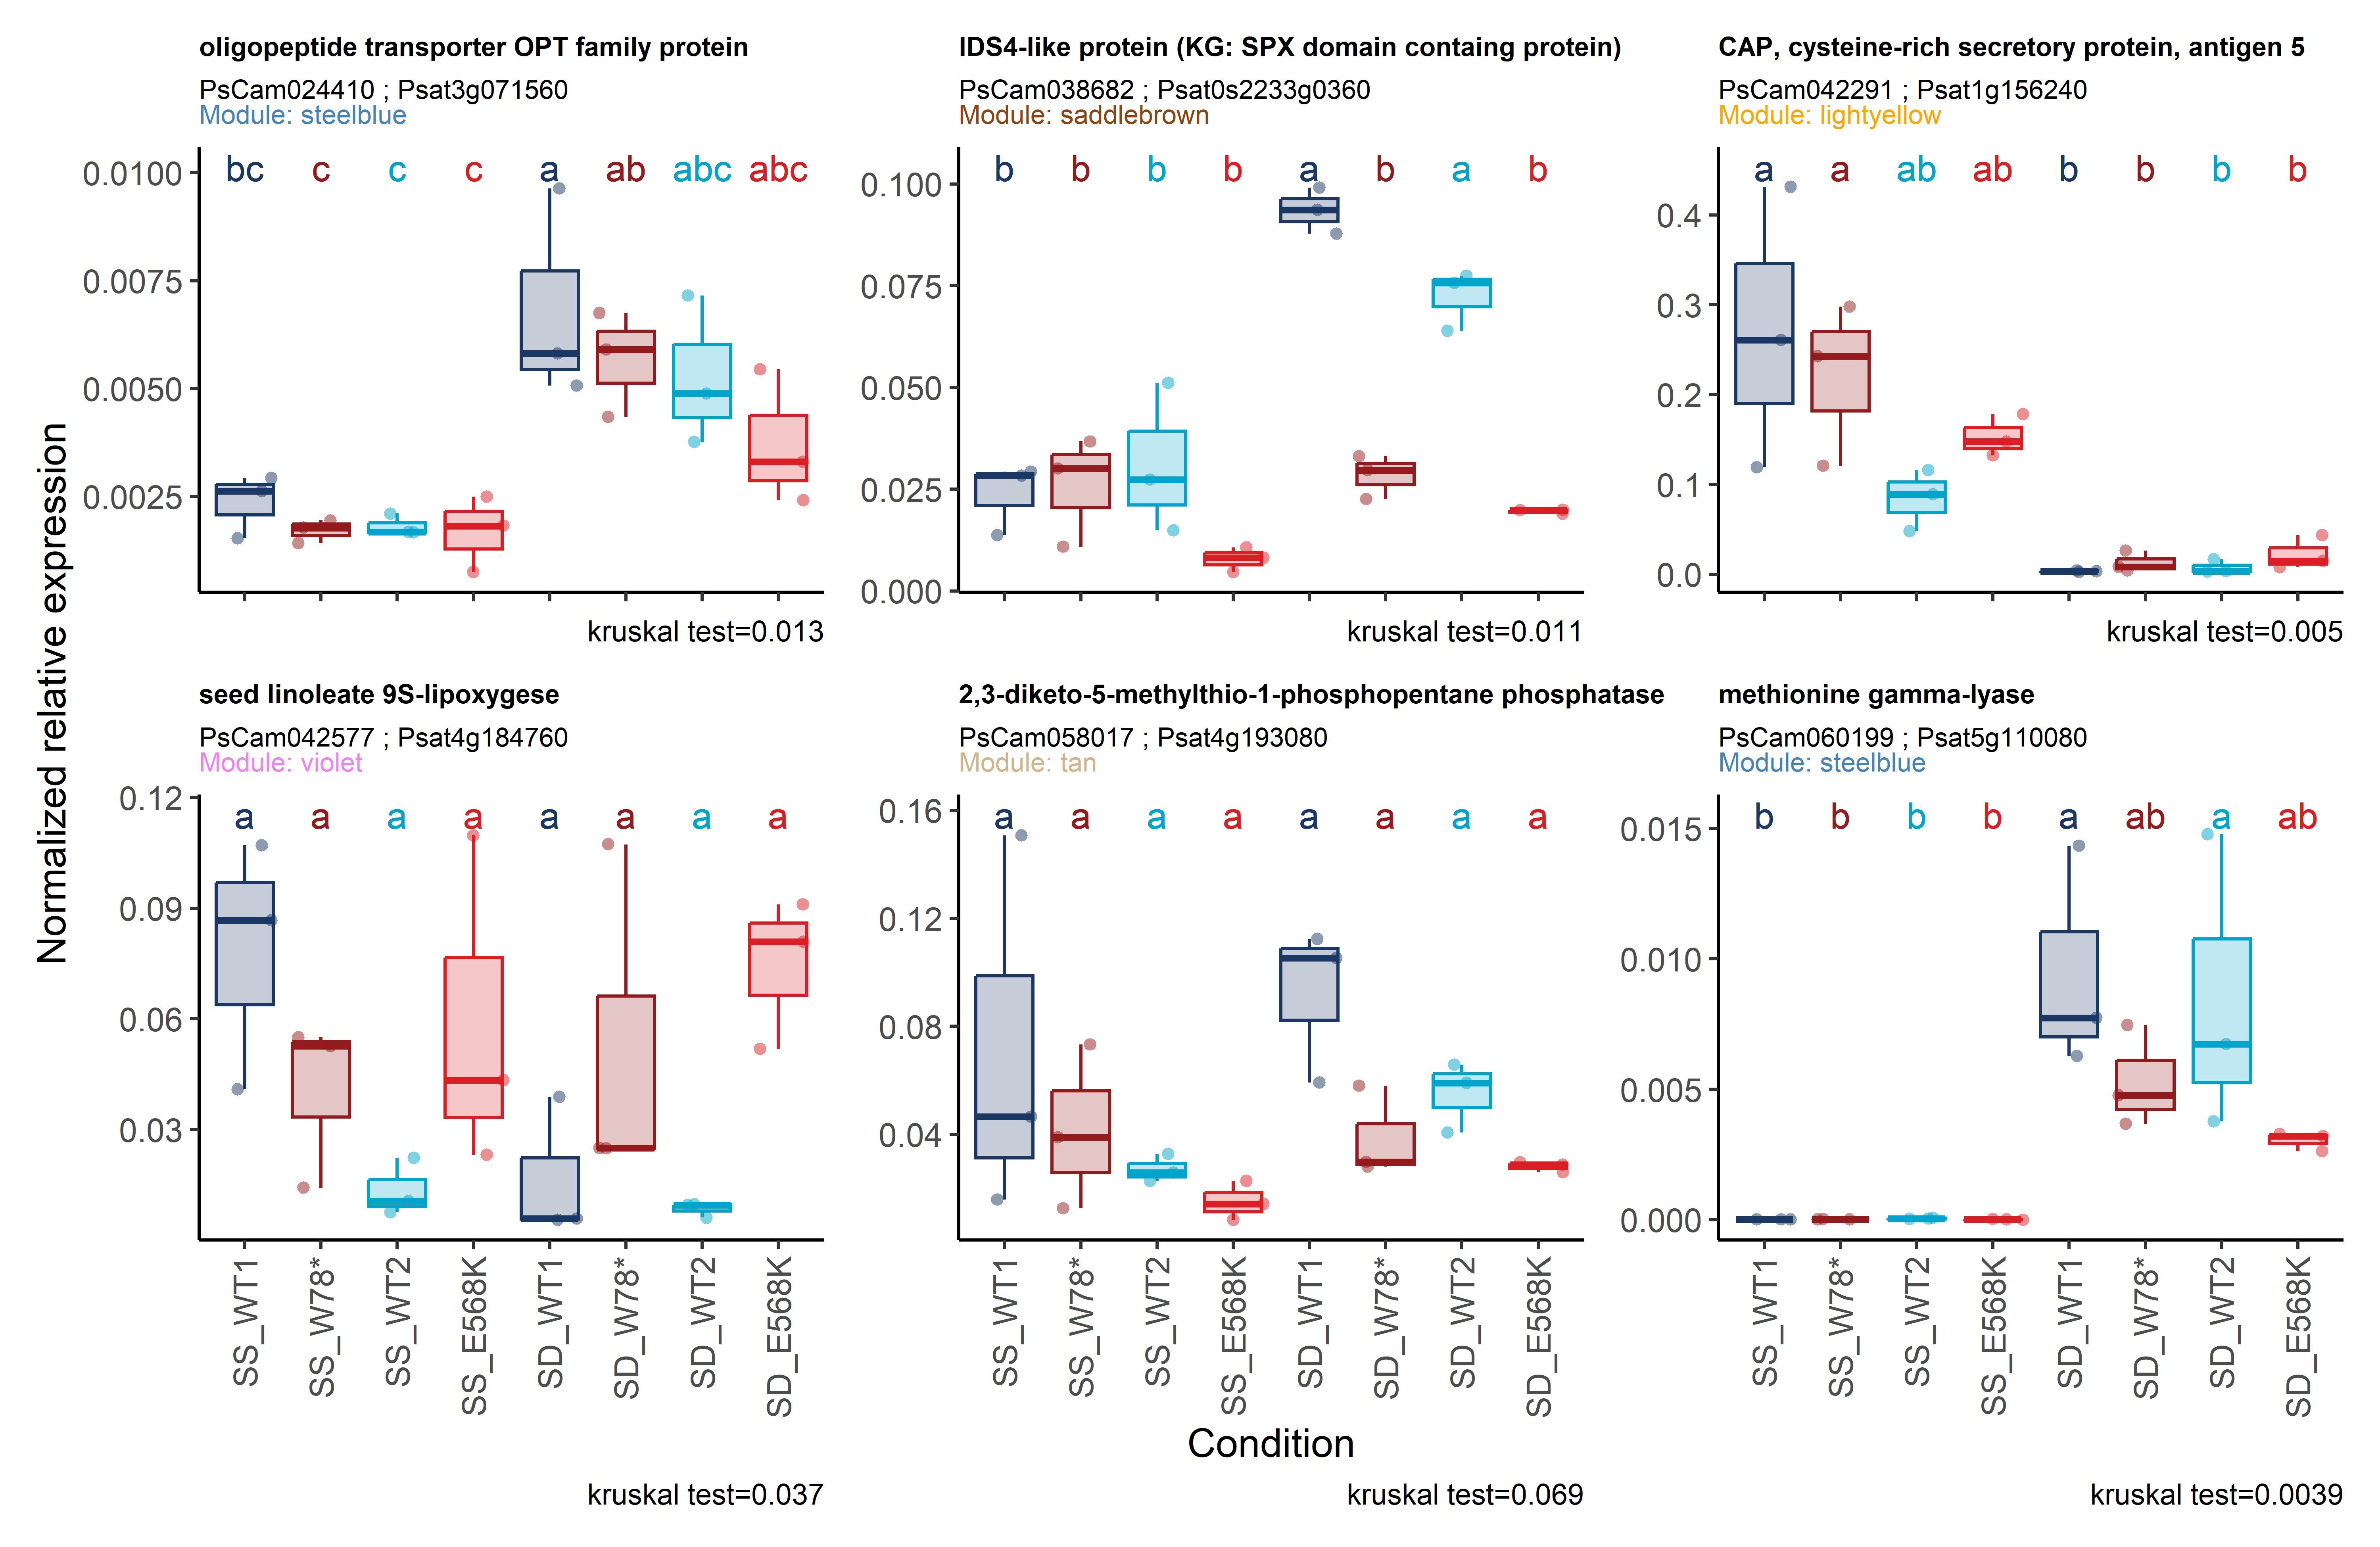
18.2 Boxplot

Code
df_qpcr <- read_csv(here::here("data/qpcr/output/qPCR.csv"),
                    col_types = cols(
                      genotype = col_factor(),
                      sulfur_condition = col_factor(),
                      type_genotype = col_factor()),
                    show_col_types = FALSE) %>% 
  mutate(
    condition = paste0(sulfur_condition, "_", genotype),
    condition = fct_relevel(condition, "SS_WT1", "SS_W78*", "SS_WT2", "SS_E568K", "SD_WT1", "SD_W78*", "SD_WT2", "SD_E568K"),
    genotype=fct_relevel(genotype, "WT1", "W78*", "WT2", "E568K"),
    sulfur_condition = fct_relevel(sulfur_condition, "SS", "SD"), 
    type_genotype = fct_relevel(type_genotype, "WT", "Mut")
    ) %>% 
  left_join(., read_excel(here::here("data/multi_omic/table_supp_all_genes.xlsx")) %>% dplyr::select(PsCam, cluster) %>% mutate(pscam_clust = paste0(PsCam, cluster)) %>% distinct(pscam_clust, .keep_all = T), by = "PsCam") %>% 
  filter(PsCam %in% c("PsCam024410", "PsCam038682", "PsCam042291", "PsCam042577" , "PsCam058017" , "PsCam060199")) 
  

levels(as.factor(df_qpcr$PsCam))
# for (var in levels(as.factor(df_qpcr$PsCam))){
#   df_qpcr_select = df_qpcr %>% 
#     filter(PsCam == var)
#   
#   p <- stat_analyse(
#         data=df_qpcr_select %>% 
#           as.data.frame(),
#           
#         column_value = "value_normalized_with_actine",
#         category_variables = c("condition"),
#         grp_var = "",
#         show_plot = T,
#         outlier_show = F, 
#         label_outlier = "plant_id",
#         biologist_stats = T,
#         Ylab_i =  "Normalized relative \nexpression",
#         control_conditions = "",
#         strip_normale = F,
#         hex_pallet = rep(as.character(mutant_palette),2)
#   )
#   
#   subtitle_i = paste0(df_qpcr_select %>% head(1) %>% pull(PsCam),
#                       " ; ",
#                       df_qpcr_select %>% head(1) %>% pull(Psat)
#                       )
#   p <-p[["plot"]]+labs(color="Genotype",fill="Genotype",x="Condition", y = "Normalized relative \nexpression", title = df_qpcr_select %>% head(1) %>% pull(note), subtitle = subtitle_i )+
#   theme(
#     legend.position = "none",                       # 1. Supprimer la légende
#     axis.text.x = element_text(angle = 90, vjust = 0.5, hjust = 1),  # 2. Rotation des labels X
#     plot.title = element_text(size = 8),
#     plot.subtitle = element_text(size = 8)
#   )
#     
#   fig_export(here::here(paste0("report/qpcr/plot/", var)), format= "png", p, height_i = 3.5, width_i = 5, res_i = 600)
# }

# ---- 1. Construire chaque figure et la stocker ------------------------------
plot_list <- list()

n_col <- 3                       # ❶ => même valeur que dans wrap_plots()
i_plot <- 0                      # ❷ => compteur pour savoir la position du panneau

for (var in levels(as.factor(df_qpcr$PsCam))) {
  i_plot <- i_plot + 1

  df_qpcr_select <- df_qpcr %>% 
    filter(PsCam == var) %>% 
    as.data.frame()

  p <- stat_analyse(
        data = df_qpcr_select,
        column_value       = "value_normalized_with_actine",
        category_variables = c("condition"),
        grp_var            = "",
        show_plot          = TRUE,
        outlier_show       = FALSE,
        label_outlier      = "plant_id",
        biologist_stats    = TRUE,
        Ylab_i             = "Normalized relative expression",
        control_conditions = "",
        strip_normale      = FALSE,
        hex_pallet         = rep(as.character(mutant_palette), 2)
      )[["plot"]]

  subtitle_i <- paste0(
    df_qpcr_select$PsCam[1], " ; ", df_qpcr_select$Psat[1],
    "<br><span style='color:", ifelse(df_qpcr_select$cluster[1] == "lightyellow","orange", df_qpcr_select$cluster[1]), ";'>Module: ", df_qpcr_select$cluster[1], "</span>"
  )
  # subtitle_i <- paste(df_qpcr_select$PsCam[1], "; ", df_qpcr_select$Psat[1])

  p <- p +
    labs(
      title    = df_qpcr_select$note[1],
      subtitle = subtitle_i,
      colour   = "Genotype",
      fill     = "Genotype", 
      x = "Condition"
    ) +
    theme(
      legend.position = "none",
      axis.text.x     = element_text(angle = 90, vjust = 0.5, hjust = 1),
      plot.title      = element_text(size = 8),
      plot.subtitle   = ggtext::element_markdown(size = 8)
    )

  ## ------------------------------------------------------------------------
  ## Cacher l’axe X si le panneau n’est PAS sur la dernière ligne
  ## ------------------------------------------------------------------------
  n_plots      <- length(levels(as.factor(df_qpcr$PsCam)))
  last_row_idx <- ((n_plots - n_col) + 1):n_plots   # indices des panneaux du bas

  if (!(i_plot %in% last_row_idx)) {
    p <- p +
      theme(
        axis.text.x  = element_blank()
      )
  }

  plot_list[[var]] <- p
}

combined_plot <-
  wrap_plots(plotlist = plot_list, ncol = n_col, guides = "collect") +
 plot_layout(axis_titles = "collect")
# ---- 3. Exporter ------------------------------------------------------------
fig_export(
  path = here::here("report/qpcr/plot/combined_qpcr"),
  combined_plot,
  height_i  = 6.5,
  width_i   = 10,
  res_i     = 600
)