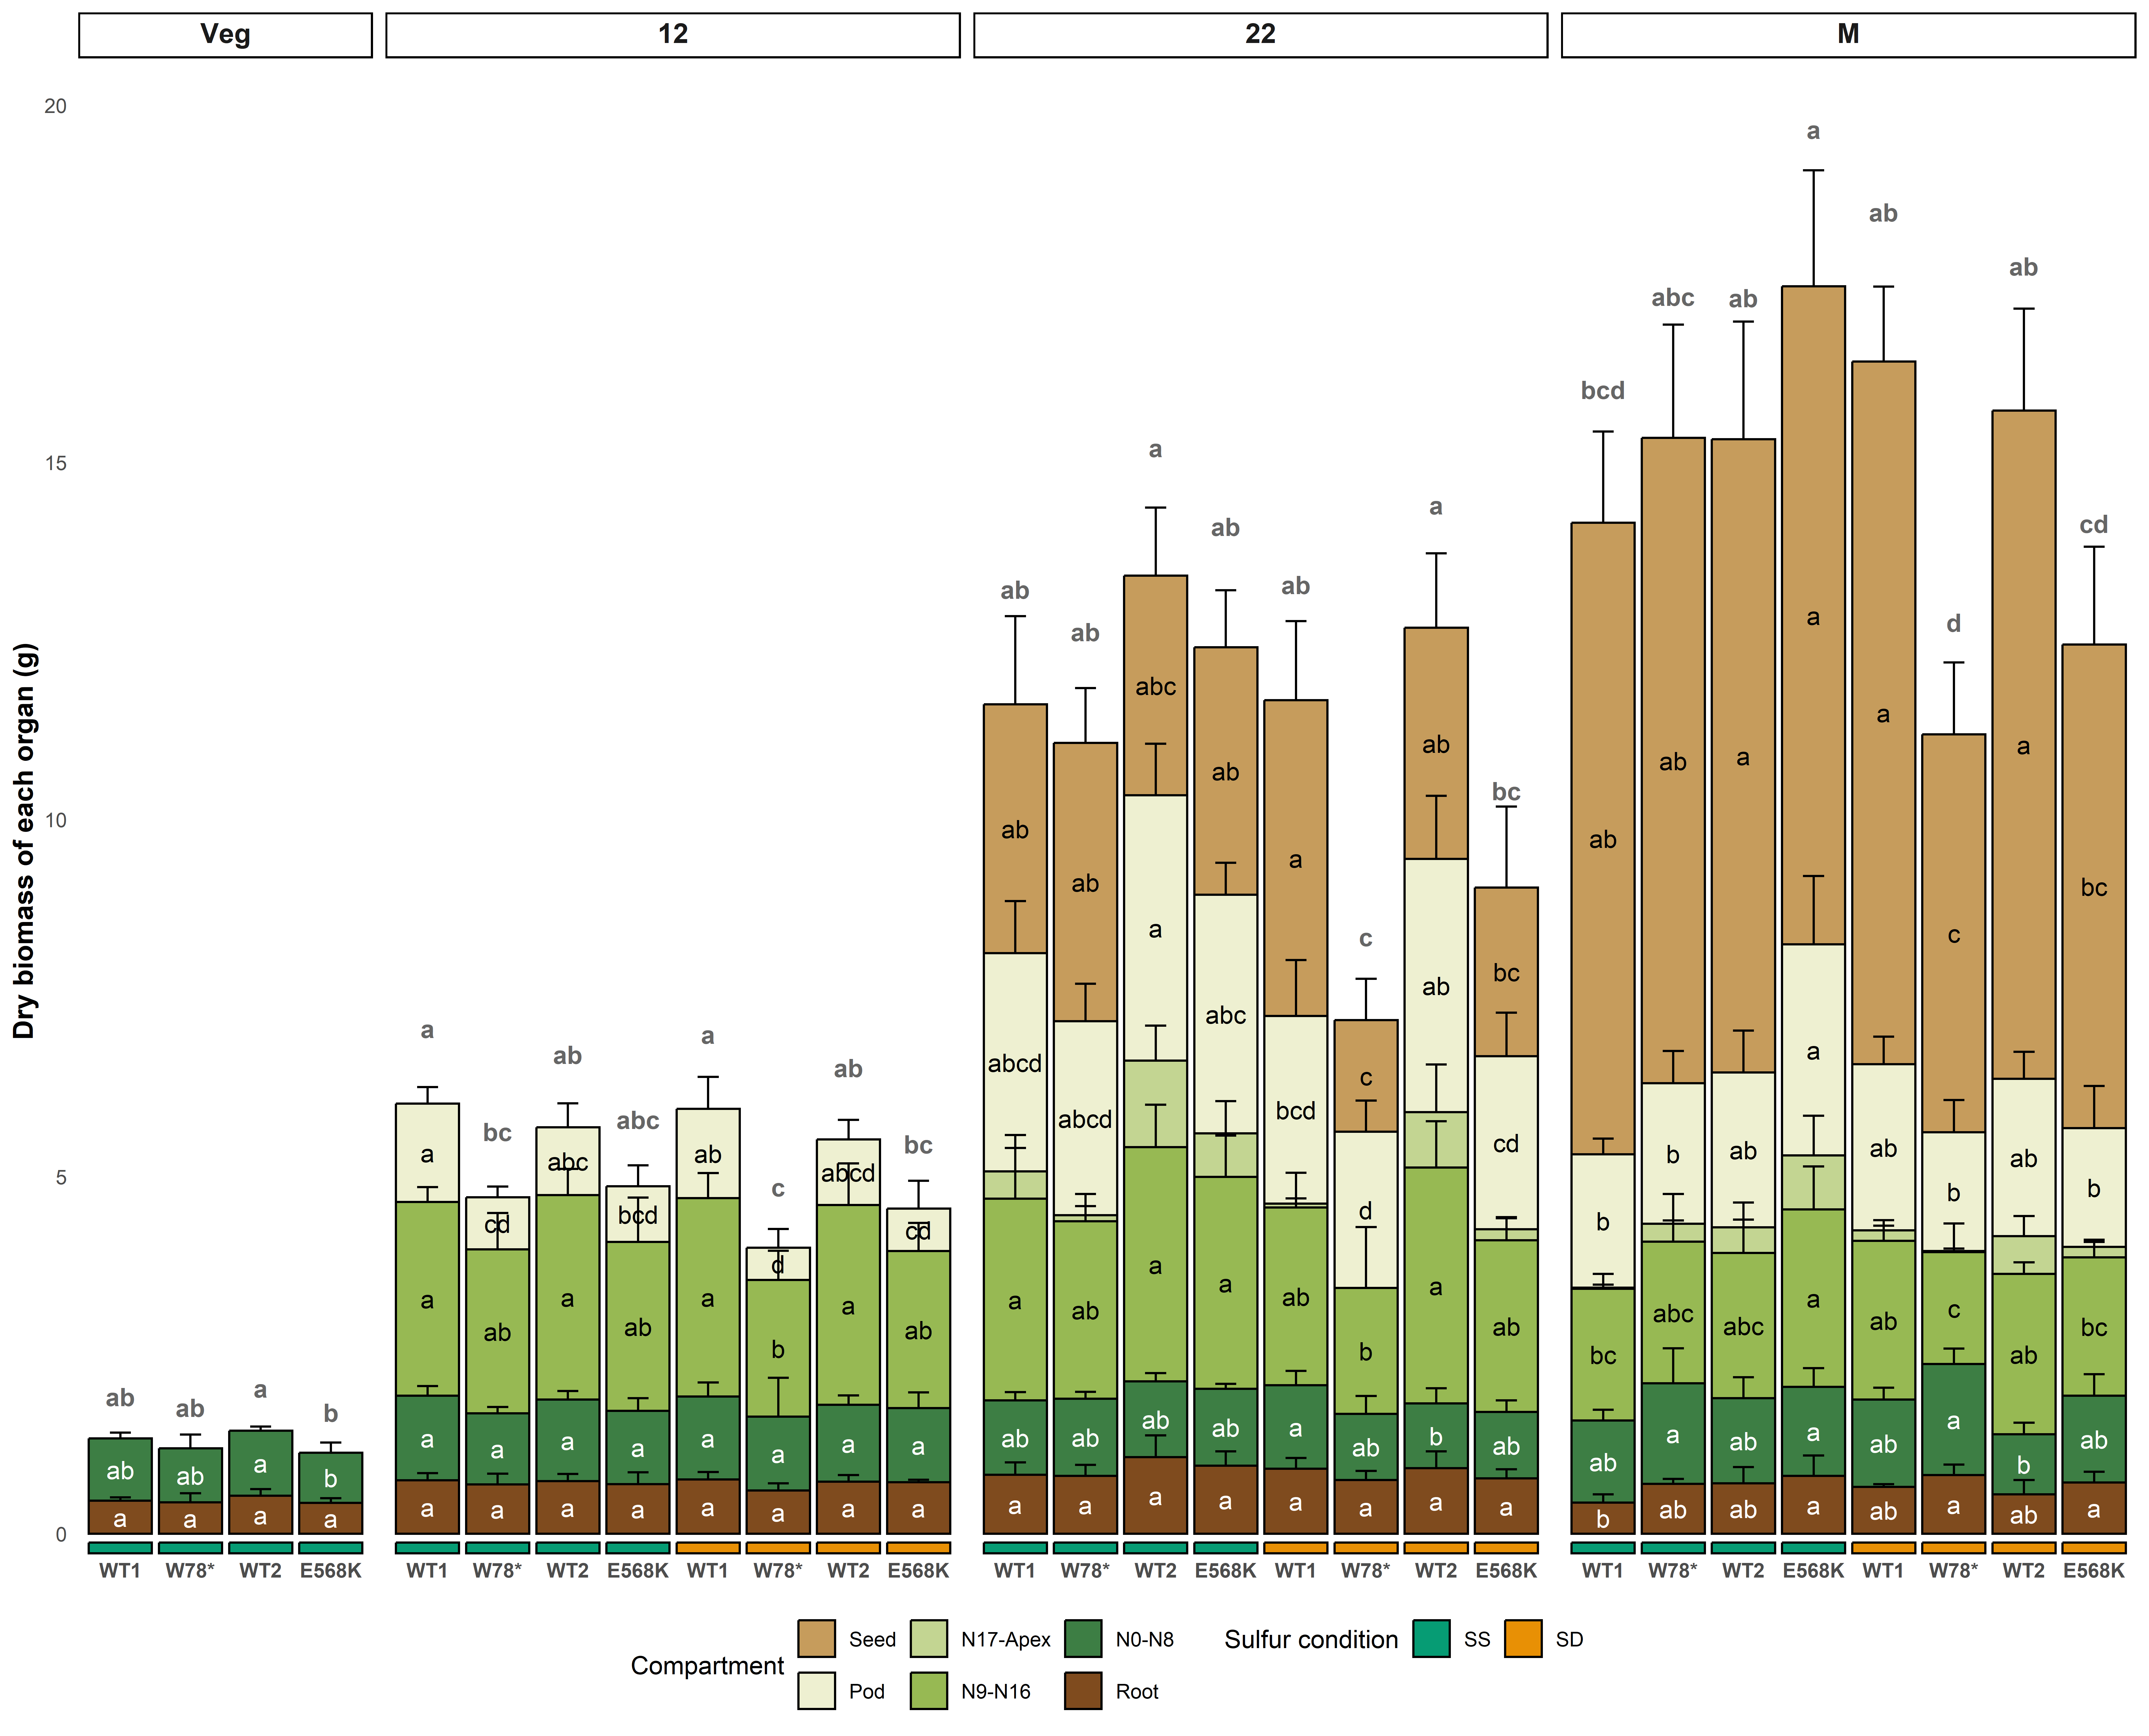
--- output: html_document editor_options: chunk_output_type: console --- ## Biomass {#biomass} [ experiment 2 ](#experimental_design) ```{r} #pkg library (readxl)library (tidyverse)library (ggnewscale) # to have two scale_fill library (ggh4x)# src source (here:: here ("src/function/stat_function/stat_analysis_main.R" )) # for make plot source (here:: here ("src/function/fig_export.R" )) # This function saves a given plot (plot_x) as both a PDF and a high-resolution PNG file at specified dimensions. # cosmetics = read_excel (here:: here ("data/color_palette.xlsm" )) %>% filter (set == "sulfure_condition" ) %>% :: select (color, treatment) %>% pull (color) %>% setNames (read_excel (here:: here ("data/color_palette.xlsm" )) %>% filter (set == "sulfure_condition" ) %>% pull (treatment)``` ```{r, eval =F} # need to move in physio raw_file <- read_excel(here::here("data/CNS/data_pheno_CNS_PO_20140507_V09.xlsx"), sheet = "for_r_importation", col_names = T) %>% mutate(sulfur_condition = ifelse(sulfur_condition == "S+", "SS", "SD")) %>% dplyr::mutate(genotype = case_when( genotype %in% "sultr4;1.1" ~ "W78*", genotype %in% "sultr4;1.2" ~ "E568K", genotype %in% "wt.1" ~ "WT1", genotype %in% "wt.2" ~ "WT2", TRUE ~ "Other variable" )) %>% mutate(genotype = forcats::fct_relevel(genotype, "WT1", "W78*", "WT2", "E568K"), condition = paste(sep = "_", genotype, sulfur_condition), sulfur_condition = forcats::fct_relevel(sulfur_condition, "SS", "SD"), stage = forcats::fct_relevel(stage, "Veg", "M", "12", "22"), condition = forcats::fct_relevel(condition, "WT1_SS", "WT1_SD", "W78*_SS", "W78*_SD", "WT2_SS", "WT2_SD", "E568K_SS", "E568K_SD") ) raw_file_l = raw_file %>% pivot_longer( cols = -c(1:7), names_to = "variable", values_to = "value" ) raw_file_l_biomass = raw_file_l %>% filter(variable %in% c("root_weight_g", "veg_N0_N8_g", "veg_N9_N16_g", "veg_N17_apex_g", "pod_weight_g","seed_yield_g")) %>% dplyr::mutate(variable = case_when( variable %in% "root_weight_g" ~ "Root", variable %in% "veg_N0_N8_g" ~ "N0-N8", variable %in% "veg_N9_N16_g" ~ "N9-N16", variable %in% "veg_N17_apex_g" ~ "N17-Apex", variable %in% "pod_weight_g" ~ "Pod", variable %in% "seed_yield_g" ~ "Seed", TRUE ~ "Other variable" )) %>% mutate(variable = forcats::fct_relevel(variable,"Seed", "Pod", "N17-Apex","N9-N16", "N0-N8","Root")) %>% mutate(value = ifelse(is.na(value), 0,value)) %>% arrange(stage, variable, genotype) %>% mutate(sulfur_condition = forcats::fct_relevel(sulfur_condition, "SS", "SD"), stage = forcats::fct_relevel(stage, "Veg", "12", "22", "M"), condition = forcats::fct_relevel(condition, "WT1_SS", "WT1_SD", "W78*_SS", "W78*_SD", "WT2_SS", "WT2_SD", "E568K_SS", "E568K_SD")) raw_file_l_biomass_sum = raw_file_l_biomass %>% dplyr::group_by(sulfur_condition, stage, genotype, condition, plant_num) %>% dplyr::mutate(Sum = sum(value, na.rm = T)) %>% dplyr::mutate(condition_stage = paste0(condition,"_", stage)) %>% mutate(sulfur_condition = forcats::fct_relevel(sulfur_condition, "SS", "SD"), stage = forcats::fct_relevel(stage, "Veg", "12", "22","M"), condition = forcats::fct_relevel(condition, "WT1_SS", "W78*_SS", "WT2_SS", "E568K_SS", "WT1_SD","W78*_SD", "WT2_SD", "E568K_SD")) %>% ungroup() raw_file_l_biomass_global_sum <- raw_file_l_biomass_sum %>% dplyr::group_by(condition, condition_stage) %>% dplyr::mutate(Mean_Sum = mean(Sum)) %>% ungroup() # stats for all df_sum # p <- stat_analyse( # data= raw_file_l_biomass_sum %>% # filter(stage == "M") %>% # as.data.frame() %>% # drop_na(Sum), # column_value = "Sum", # category_variables = c("sulfur_condition"), # grp_var = "genotype", # show_plot = T, # outlier_show = F, # label_outlier = "plant_num", # biologist_stats = T, # control_conditions = c("SS"), # strip_normale = F, # hex_pallet = sulfate_pallet # ) df_stats_global_sum <- as.data.frame(matrix(data = c("WT1_SS_Veg", "W78*_SS_Veg", "WT2_SS_Veg","E568K_SS_Veg", "WT1_SS_12", "W78*_SS_12", "WT2_SS_12","E568K_SS_12", "WT1_SD_12", "W78*_SD_12", "WT2_SD_12","E568K_SD_12", "WT1_SS_22", "W78*_SS_22", "WT2_SS_22","E568K_SS_22", "WT1_SD_22", "W78*_SD_22", "WT2_SD_22","E568K_SD_22", "WT1_SS_M", "W78*_SS_M", "WT2_SS_M","E568K_SS_M", "WT1_SD_M", "W78*_SD_M", "WT2_SD_M","E568K_SD_M", "ab","ab","a","b", "a","bc","ab","abc","a","c","ab","bc", "ab","ab","a","ab","ab","c","a","bc", "bcd","abc","ab","a","ab","d","ab","cd" ),nrow = 28,ncol = 2)) ; colnames(df_stats_global_sum) = c("condition_stage", "group") df_stats_global_sum= df_stats_global_sum %>% left_join(., raw_file_l_biomass_global_sum, by = "condition_stage") %>% distinct(condition_stage, .keep_all = T) raw_file_l_biomass_summary = raw_file_l_biomass %>% dplyr::group_by(sulfur_condition, stage, genotype, condition, variable) %>% dplyr::summarise(Mean = mean(value, na.rm = T), SD = sd(value, na.rm = T)) %>% dplyr::mutate(condition_stage = paste0(condition,"_", stage)) %>% mutate(variable = forcats::fct_relevel(variable, "Seed", "Pod", "N17-Apex","N9-N16", "N0-N8","Root")) %>% mutate(sulfur_condition = forcats::fct_relevel(sulfur_condition, "SS", "SD"), stage = forcats::fct_relevel(stage, "Veg", "12", "22","M"), condition = forcats::fct_relevel(condition, "WT1_SS", "W78*_SS", "WT2_SS", "E568K_SS", "WT1_SD","W78*_SD", "WT2_SD", "E568K_SD")) %>% arrange(desc(variable)) raw_file_l_biomass_summary = plyr::ddply(raw_file_l_biomass_summary, "condition_stage", transform, label_ypos=cumsum(Mean)) %>% mutate(condition_stage_variable = paste0(condition_stage, "_", variable)) # get all stats for each compartment and each stage with my function then mergev with condition_stage_variable column df_stats_global = data.frame(matrix(data = NA, nrow = 0, ncol = 2 )) ; colnames(df_stats_global) = c("condition_stage_variable ", "group") list_analyse <- raw_file_l_biomass_summary %>% dplyr::select(variable,stage, Mean) %>% mutate(variable_stage = paste(sep = "_", variable, stage) ) %>% distinct(variable_stage, .keep_all = TRUE) %>% filter(Mean>0) %>% filter(variable != "N17-Apex") %>% filter(stage != "Veg") for(i in 1:nrow(list_analyse)){ cat_col(text = list_analyse$variable_stage[i], color = "blue" ) p <- stat_analyse( data= raw_file_l_biomass %>% filter(variable == list_analyse$variable[i], stage == list_analyse$stage[i]) %>% as.data.frame() %>% drop_na(value), column_value = "value", category_variables = c("sulfur_condition"), grp_var = "genotype", show_plot = T, outlier_show = F, label_outlier = "plant_num", biologist_stats = T, control_conditions = c("SS"), strip_normale = F, hex_pallet = sulfate_pallet ) df_stats = p[["data_stats"]] %>% dplyr::select(condition, stage, variable, group) %>% mutate(condition_stage_variable = paste(sep = "_", condition, stage, variable)) %>% distinct(condition_stage_variable, .keep_all = TRUE) %>% dplyr::select(condition_stage_variable, group) df_stats_global= rbind(df_stats_global, df_stats) } # idem but only for Veg because this is note the same formate p <- stat_analyse( data= raw_file_l_biomass %>% filter(variable == "Root", stage == "Veg") %>% as.data.frame() %>% drop_na(value), column_value = "value", category_variables = c("genotype"), #grp_var = "genotype", show_plot = T, outlier_show = F, label_outlier = "plant_num", biologist_stats = T, #control_conditions = c("SS"), strip_normale = F, hex_pallet = sulfate_pallet ) p <- stat_analyse( data= raw_file_l_biomass %>% filter(variable == "N0-N8", stage == "Veg") %>% as.data.frame() %>% drop_na(value), column_value = "value", category_variables = c("genotype"), #grp_var = "genotype", show_plot = T, outlier_show = F, label_outlier = "plant_num", biologist_stats = T, #control_conditions = c("SS"), strip_normale = F, hex_pallet = sulfate_pallet ) df_stats_manuel <- as.data.frame(matrix(data = c("WT1_SS_Veg_Root", "W78*_SS_Veg_Root", "WT2_SS_Veg_Root","E568K_SS_Veg_Root", "WT1_SS_Veg_N0-N8", "W78*_SS_Veg_N0-N8", "WT2_SS_Veg_N0-N8","E568K_SS_Veg_N0-N8", "a","a","a","a", "ab","ab","a","b"),nrow = 8,ncol = 2)) ; colnames(df_stats_manuel) = c("condition_stage_variable", "group") # create table manually to integrate with previous results df_stats_global= rbind(df_stats_global, df_stats_manuel) raw_file_l_biomass_summary=raw_file_l_biomass_summary %>% full_join(.,df_stats_global, by="condition_stage_variable") %>% mutate(group= ifelse(is.na(group),"",group)) p_final = ggplot(raw_file_l_biomass_summary, aes(x = condition, y = Mean, fill = variable)) + geom_text(position = position_stack(vjust = 1.00),data = df_stats_global_sum, aes(y = Mean_Sum*1.1+.45, label = group),fontface = "bold",color="gray40")+ facet_grid(~stage, scales = "free_x", space = "free_x") + geom_bar(stat = "identity", colour = "black") + ylab("Dry biomass of each organ (g)")+ geom_errorbar( aes(ymin = label_ypos, ymax = label_ypos + SD), size = 0.5, width = 0.3, position = position_identity(), colour = "black" )+ scale_fill_manual(values = c("#C69C5C", # geno "#EEF0D1", "#C3D592", "#97B953", "#3D7E44", "#7F4B1E"), ), name = "Compartment") + new_scale_fill() + scale_fill_manual(values = c("#069C74","#E89005"),name ="Sulfur condition")+ geom_tile(aes(x = condition, y = -.2, # Adjust this value to move the rectangles downwards, fill = sulfur_condition, col = "black", width = 0.90, height = 0.15 ), data = raw_file_l_biomass_summary, color="black", size = .5, alpha = 1, inherit.aes = FALSE)+ geom_text(aes(label = group), vjust = 0.5, color = ifelse(raw_file_l_biomass_summary$variable %in% c("Root", "N0-N8"), "white", "black"), position = position_stack(vjust = 0.5))+ scale_x_discrete(labels = rep(c("WT1", "W78*", "WT2", "E568K"),4))+ theme_minimal()+ theme(panel.grid = element_blank(), axis.text.x = element_text(face = "bold",margin = margin(t = -30)), axis.title.y = element_text(size=12, face="bold"), axis.title.x = element_blank(), strip.text = element_text(face = "bold",vjust = 1,size = 12), strip.background = element_rect(fill = "white", color = "black", size = 0.8), strip.placement = "outside", legend.position = "bottom" ) # export fig #### fig_export(here::here("report/physio/plot/resum_biomass_organ"), p_final, height_i = 10.5, width_i = 13, res_i = 600) ```