#pkglibrary(readxl)library(here)library(readxl)library(tidyverse)library(ggnewscale) # to have two scale_filllibrary(ggh4x)library(kableExtra)library("FactoMineR")library("factoextra")library(patchwork)library(ggstats)# srcsource(here::here("src/function/stat_function/stat_analysis_main.R")) # for make plot source(here::here("src/function/fig_export.R")) # This function saves a given plot (plot_x) as both a PDF and a high-resolution PNG file at specified dimensions.# cosmeticssulfate_pallet=read_excel(here::here("data/color_palette.xlsm")) %>%filter(set =="sulfure_condition") %>% dplyr::select(color, treatment) %>%pull(color) %>%setNames(read_excel(here::here("data/color_palette.xlsm")) %>%filter(set =="sulfure_condition") %>%pull(treatment) )mutant_palette=read_excel(here::here("data/color_palette.xlsm")) %>%filter(set =="mutant") %>% dplyr::select(color, treatment) %>%pull(color) %>%setNames(read_excel(here::here("data/color_palette.xlsm")) %>%filter(set =="mutant") %>%pull(treatment) )
11.1 Data importation
Code
df_sulfur <-read_excel(here::here("data/anion/2015_anions_juin_modif.xlsx"), col_names = T, sheet ="sulfate_raw") %>%mutate(# extraire la partie entre parenthèses pour sulfur_conditionsulfur_condition =if_else(str_detect(`Code échantillon`, "S-"), "SD", "SS"),# extraire le code (ex: 2684 ou 4693)code =str_extract(`Code échantillon`, "\\d{4}"),# extraire le plant number entre le code et WT/Mutplant_num =str_extract(`Code échantillon`, "(?<=_)[0-9]+(?=_)"),# extraire WT ou Mutstatus =str_extract(`Code échantillon`, "WT|Mut"),# définir le génotypegenotype =case_when( code =="2684"& status =="WT"~"WT2", code =="2684"& status =="Mut"~"E568K", code =="4693"& status =="WT"~"WT1", code =="4693"& status =="Mut"~"W78*",TRUE~NA_character_ ) ) %>% dplyr::rename(concentration =`conc en mg/g MS`) %>% dplyr::select(-code, -status) %>%mutate(anion ="sulfate")df_nitrate <-read_excel(here::here("data/anion/2015_anions_juin_modif.xlsx"), col_names = T, sheet ="nitrate_raw") %>%mutate(# extraire la partie entre parenthèses pour sulfur_conditionsulfur_condition =if_else(str_detect(`Code échantillon`, "S-"), "SD", "SS"),# extraire le code (ex: 2684 ou 4693)code =str_extract(`Code échantillon`, "\\d{4}"),# extraire le plant number entre le code et WT/Mutplant_num =str_extract(`Code échantillon`, "(?<=_)[0-9]+(?=_)"),# extraire WT ou Mutstatus =str_extract(`Code échantillon`, "WT|Mut"),# définir le génotypegenotype =case_when( code =="2684"& status =="WT"~"WT2", code =="2684"& status =="Mut"~"E568K", code =="4693"& status =="WT"~"WT1", code =="4693"& status =="Mut"~"W78*",TRUE~NA_character_ ) ) %>% dplyr::rename(concentration =`conc en mg/g MS`) %>% dplyr::select(-code, -status) %>%mutate(anion ="nitrate")# Mergedf_anion <-bind_rows(df_sulfur, df_nitrate) %>% dplyr::select(-c(dilution))# exportwrite_csv(x = df_anion, file = here::here("data/anion/output/df_anion_eva_caen_2015.csv"))
11.2 Analyse
11.2.1 GGcoef
Code
df_anion <-read_csv(here::here("data/anion/output/df_anion_eva_caen_2015.csv"), show_col_types =FALSE) %>%mutate(plant_num =as.factor(plant_num),sulfur_condition=fct_relevel(sulfur_condition, "SS", "SD"),genotype =as.factor(genotype),genotype=fct_relevel(genotype, "WT1", "W78*", "WT2", "E568K"), # warning is 8 compartment =as.factor(compartment), anion =as.factor(anion))df_anion_sulfate <- df_anion %>%filter(anion =="sulfate", sulfur_condition =="SD")df_anion_nitrate <- df_anion %>%filter(anion =="nitrate", sulfur_condition =="SD")cont <-contrasts(df_anion_sulfate$genotype) <- contr.sum # to say look at the big average only for genotype (juste an other representation)mod1_sultate =lm(formula = concentration ~ genotype+compartment, data = df_anion_sulfate)mod1_nitrate =lm(formula = concentration ~ genotype+compartment, data = df_anion_nitrate)p_x_sulfate<-ggcoef_model(mod1_sultate)+labs(title ="Concentration in sulfate")p_x_nitrate<-ggcoef_model(mod1_nitrate)+labs(title ="Concentration in nitrate")# exportfig_export(here::here("report/metabolomic/plot/anion_eva_2015/ggcoef_model_development_sulfate"), p_x_sulfate, height_i =5, width_i =8, res_i =300)fig_export(here::here("report/metabolomic/plot/anion_eva_2015/ggcoef_model_development_nitrate"), p_x_nitrate, height_i =5, width_i =8, res_i =300)
11.3 Stats
Code
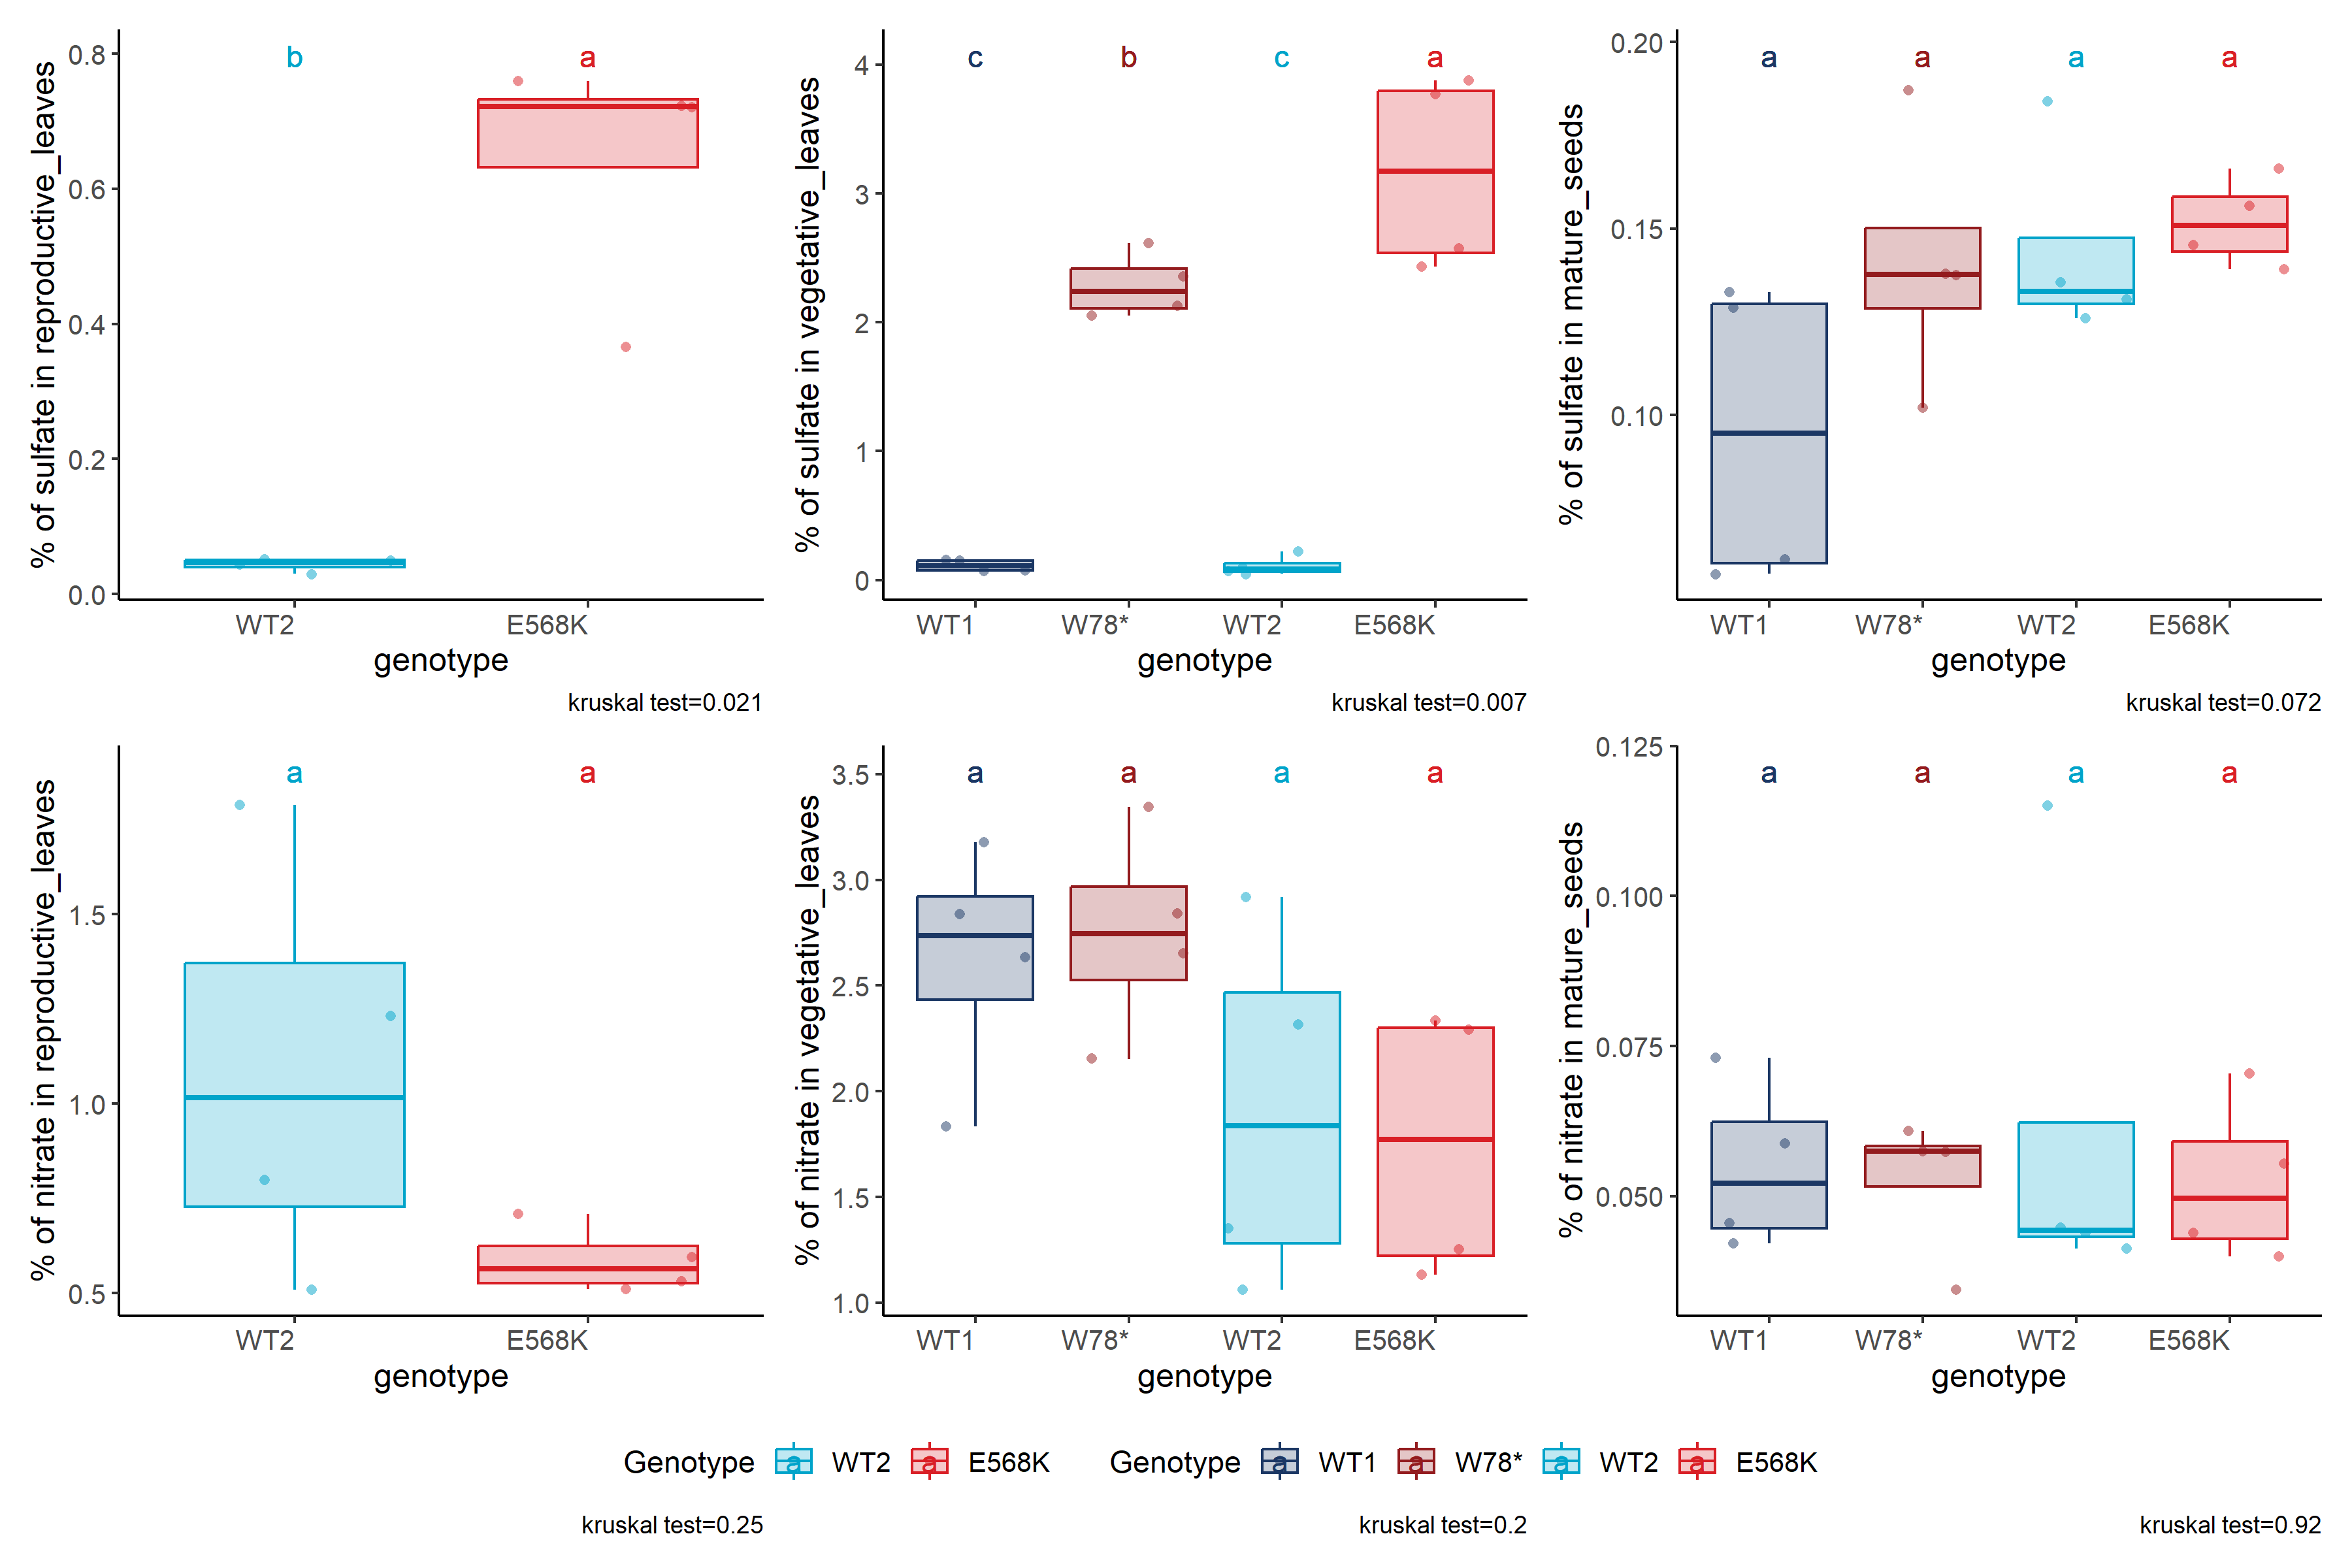
df_anion <-read_csv(here::here("data/anion/output/df_anion_eva_caen_2015.csv"), show_col_types =FALSE) %>%mutate(plant_num =as.factor(plant_num),sulfur_condition=fct_relevel(sulfur_condition, "SS", "SD"),genotype =as.factor(genotype),genotype=fct_relevel(genotype, "WT1", "W78*", "WT2", "E568K"), # warning is 8 compartment =as.factor(compartment), anion =as.factor(anion)) %>%filter(sulfur_condition =="SD") %>% dplyr::rename(number_tube =`n°tube`) %>%mutate(plant_num_tube =paste0(plant_num, "_", number_tube))write_csv(df_anion, file = here::here("data/metabolomic/output/anion_EVA.csv"))all_possibility <- df_anion %>%distinct(anion,compartment)# Initialisation de la liste qui va stocker tous les plotsplots <-list()# Boucle sur chaque combinaisonfor (i inseq_len(nrow(all_possibility))) { anion_i <- all_possibility$anion[i] compartment_i <- all_possibility$compartment[i]# Filtrage des données pour la combinaison courante df_select <- df_anion %>%filter( anion == anion_i, compartment == compartment_i ) %>%drop_na(concentration) %>%as.data.frame()# Si aucune donnée n'est disponible, on passe à la combinaison suivanteif(nrow(df_select) ==0) {message("Aucune donnée pour: ", anion_i, ", ", compartment_i)next }# Définition de l'étiquette de l'axe des ordonnées ylab_i <-paste0("% of ", anion_i, " in ", compartment_i)# Essayer d'exécuter stat_analyse et capturer les erreurs éventuelles res <-tryCatch({stat_analyse(data = df_select,column_value ="concentration",category_variables =c("genotype"),grp_var ="",show_plot =TRUE,outlier_show =FALSE, label_outlier ="plant_num_tube",biologist_stats =TRUE,Ylab_i = ylab_i,control_conditions ="",strip_normale =FALSE,hex_pallet = mutant_palette ) },error =function(e) {message("Erreur pour: ", anion_i, ", ", compartment_i, " -> ", e$message)return(NULL) })# Si une erreur s'est produite, on passe à l'itération suivanteif(is.null(res)) next# Extraction du plot et ajout des labels pour la légende p_plot <- res[["plot"]] +labs(color ="Genotype", fill ="Genotype") plot_name <-paste0(anion_i, "_", compartment_i)fig_export(here::here(paste0("report/metabolomic/plot/anion_EVA_2015/stats_plot/", plot_name)), p_plot, height_i =4, width_i =5, res_i =300,format ="png") plots[[plot_name]] <- p_plot}# Assemblage de tous les plots avec patchworkfinal_plot <-wrap_plots(plots, ncol =3) +plot_layout(guides ="collect") +plot_annotation() &theme(legend.position ='bottom')# Affichage du plot finalprint(final_plot)fig_export(here::here("report/metabolomic/plot/anion_EVA_2015/stats_plot/merge_sulfate_nitrate"), final_plot, height_i =8, width_i =12, res_i =300, format ="png")
Source Code
---output: html_documenteditor_options: chunk_output_type: console---## Anion from EVA Caen 2015 ```{r}#pkglibrary(readxl)library(here)library(readxl)library(tidyverse)library(ggnewscale) # to have two scale_filllibrary(ggh4x)library(kableExtra)library("FactoMineR")library("factoextra")library(patchwork)library(ggstats)# srcsource(here::here("src/function/stat_function/stat_analysis_main.R")) # for make plot source(here::here("src/function/fig_export.R")) # This function saves a given plot (plot_x) as both a PDF and a high-resolution PNG file at specified dimensions.# cosmeticssulfate_pallet=read_excel(here::here("data/color_palette.xlsm")) %>%filter(set =="sulfure_condition") %>% dplyr::select(color, treatment) %>%pull(color) %>%setNames(read_excel(here::here("data/color_palette.xlsm")) %>%filter(set =="sulfure_condition") %>%pull(treatment) )mutant_palette=read_excel(here::here("data/color_palette.xlsm")) %>%filter(set =="mutant") %>% dplyr::select(color, treatment) %>%pull(color) %>%setNames(read_excel(here::here("data/color_palette.xlsm")) %>%filter(set =="mutant") %>%pull(treatment) )```## Data importation ```{r, eval = F}df_sulfur <- read_excel(here::here("data/anion/2015_anions_juin_modif.xlsx"), col_names = T, sheet = "sulfate_raw") %>% mutate( # extraire la partie entre parenthèses pour sulfur_condition sulfur_condition = if_else(str_detect(`Code échantillon`, "S-"), "SD", "SS"), # extraire le code (ex: 2684 ou 4693) code = str_extract(`Code échantillon`, "\\d{4}"), # extraire le plant number entre le code et WT/Mut plant_num = str_extract(`Code échantillon`, "(?<=_)[0-9]+(?=_)"), # extraire WT ou Mut status = str_extract(`Code échantillon`, "WT|Mut"), # définir le génotype genotype = case_when( code == "2684" & status == "WT" ~ "WT2", code == "2684" & status == "Mut" ~ "E568K", code == "4693" & status == "WT" ~ "WT1", code == "4693" & status == "Mut" ~ "W78*", TRUE ~ NA_character_ ) ) %>% dplyr::rename(concentration = `conc en mg/g MS`) %>% dplyr::select(-code, -status) %>% mutate(anion = "sulfate")df_nitrate <- read_excel(here::here("data/anion/2015_anions_juin_modif.xlsx"), col_names = T, sheet = "nitrate_raw") %>% mutate( # extraire la partie entre parenthèses pour sulfur_condition sulfur_condition = if_else(str_detect(`Code échantillon`, "S-"), "SD", "SS"), # extraire le code (ex: 2684 ou 4693) code = str_extract(`Code échantillon`, "\\d{4}"), # extraire le plant number entre le code et WT/Mut plant_num = str_extract(`Code échantillon`, "(?<=_)[0-9]+(?=_)"), # extraire WT ou Mut status = str_extract(`Code échantillon`, "WT|Mut"), # définir le génotype genotype = case_when( code == "2684" & status == "WT" ~ "WT2", code == "2684" & status == "Mut" ~ "E568K", code == "4693" & status == "WT" ~ "WT1", code == "4693" & status == "Mut" ~ "W78*", TRUE ~ NA_character_ ) ) %>% dplyr::rename(concentration = `conc en mg/g MS`) %>% dplyr::select(-code, -status) %>% mutate(anion = "nitrate")# Mergedf_anion <- bind_rows(df_sulfur, df_nitrate) %>% dplyr::select(-c(dilution))# exportwrite_csv(x = df_anion, file = here::here("data/anion/output/df_anion_eva_caen_2015.csv"))```## Analyse### GGcoef```{r, eval = F}df_anion <- read_csv(here::here("data/anion/output/df_anion_eva_caen_2015.csv"), show_col_types = FALSE) %>% mutate(plant_num = as.factor(plant_num), sulfur_condition= fct_relevel(sulfur_condition, "SS", "SD"), genotype = as.factor(genotype), genotype=fct_relevel(genotype, "WT1", "W78*", "WT2", "E568K"), # warning is 8 compartment = as.factor(compartment), anion = as.factor(anion))df_anion_sulfate <- df_anion %>% filter(anion == "sulfate", sulfur_condition == "SD")df_anion_nitrate <- df_anion %>% filter(anion == "nitrate", sulfur_condition == "SD")cont <- contrasts(df_anion_sulfate$genotype) <- contr.sum # to say look at the big average only for genotype (juste an other representation)mod1_sultate = lm(formula = concentration ~ genotype+compartment, data = df_anion_sulfate)mod1_nitrate = lm(formula = concentration ~ genotype+compartment, data = df_anion_nitrate)p_x_sulfate<-ggcoef_model(mod1_sultate)+ labs(title = "Concentration in sulfate")p_x_nitrate<-ggcoef_model(mod1_nitrate)+ labs(title = "Concentration in nitrate")# exportfig_export(here::here("report/metabolomic/plot/anion_eva_2015/ggcoef_model_development_sulfate"), p_x_sulfate, height_i = 5, width_i = 8, res_i = 300)fig_export(here::here("report/metabolomic/plot/anion_eva_2015/ggcoef_model_development_nitrate"), p_x_nitrate, height_i = 5, width_i = 8, res_i = 300)```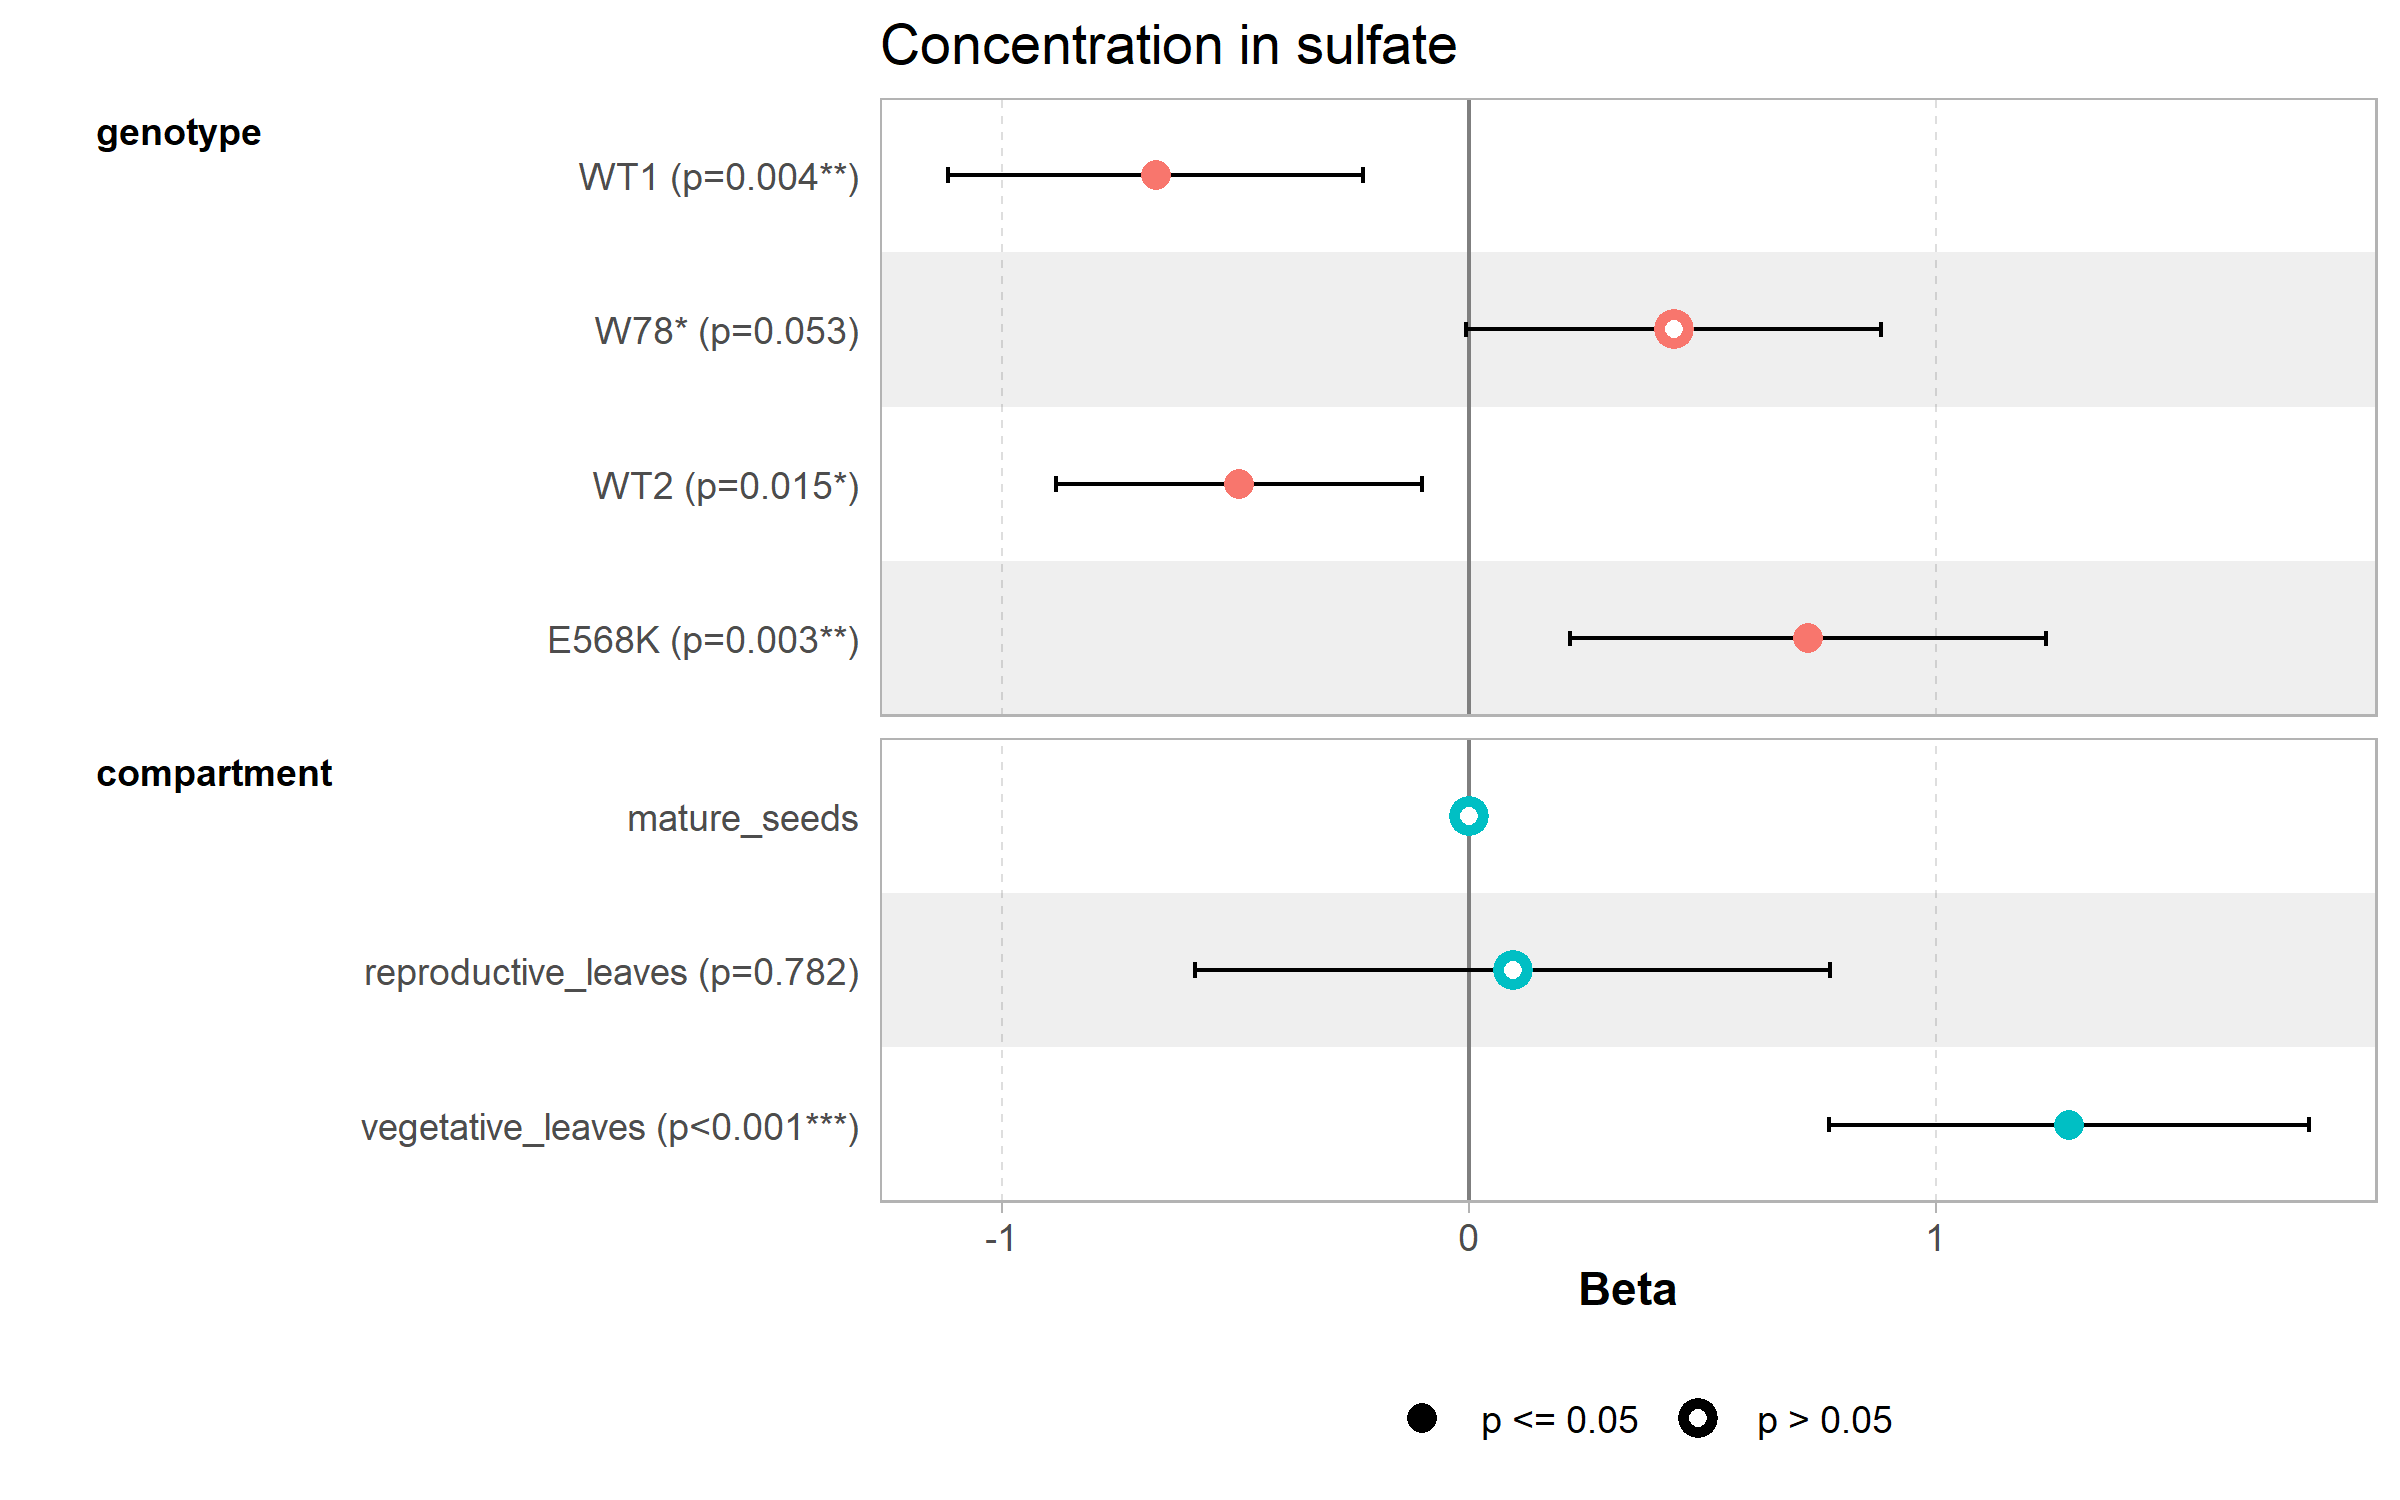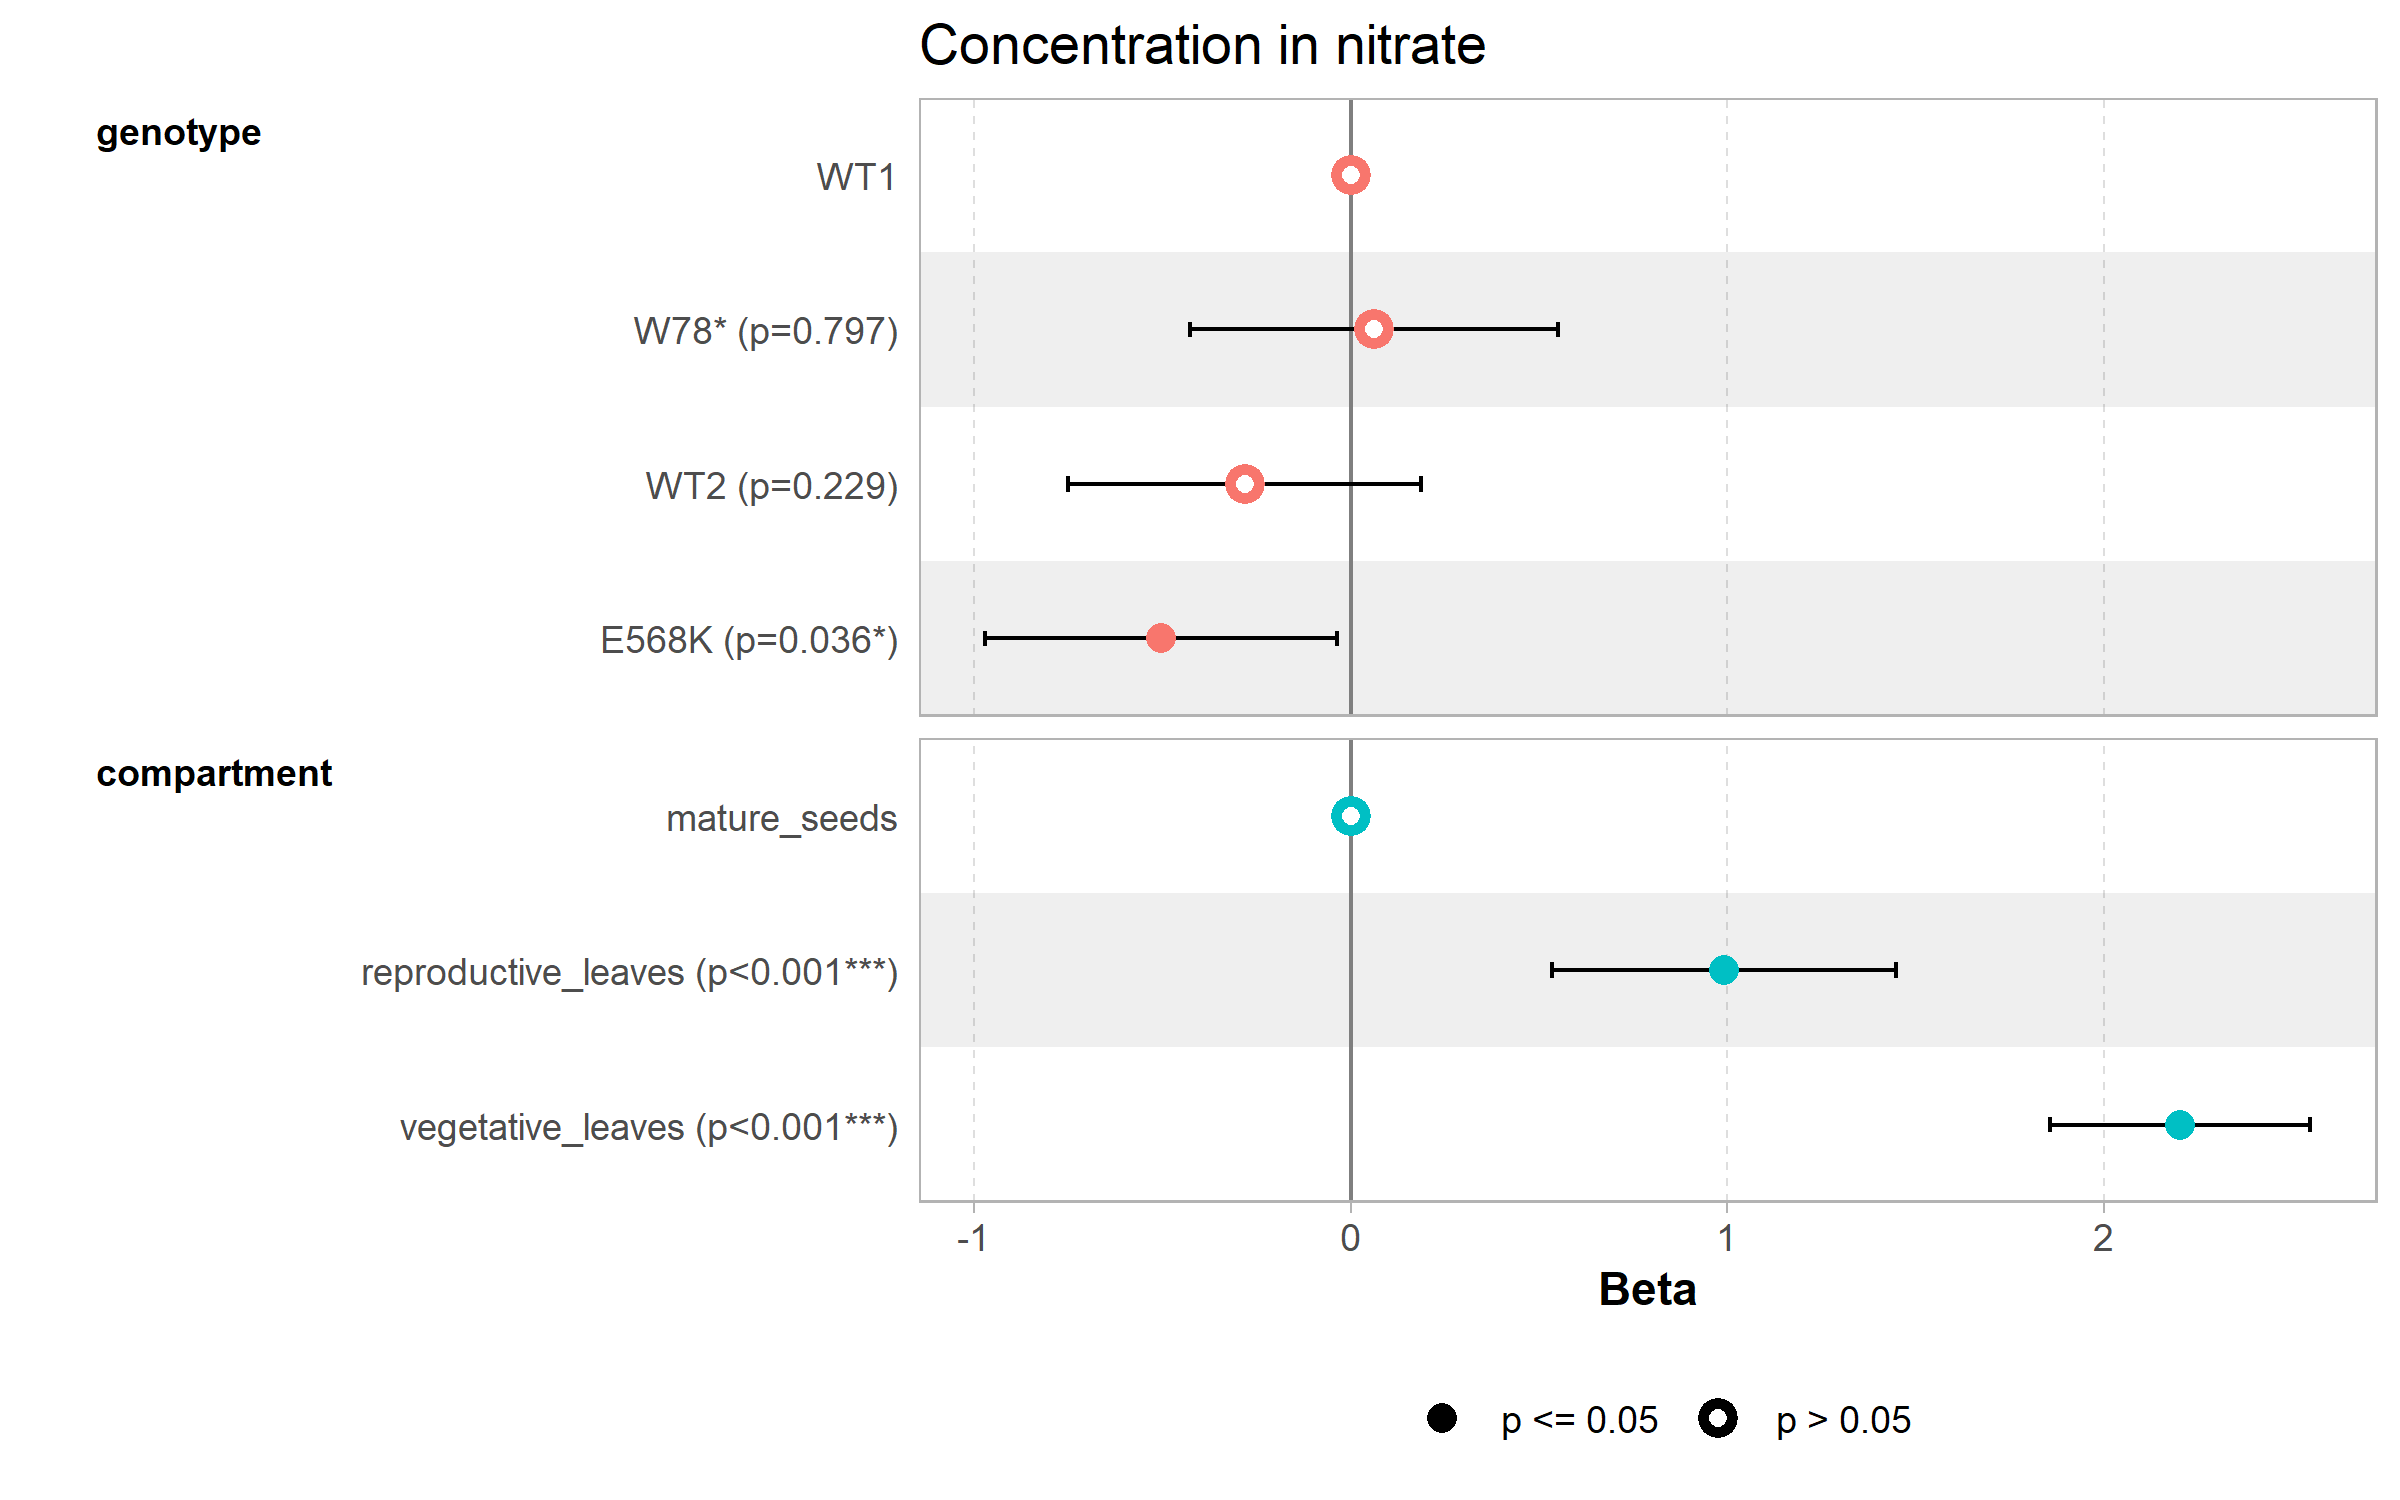## Stats ```{r, eval = F}df_anion <- read_csv(here::here("data/anion/output/df_anion_eva_caen_2015.csv"), show_col_types = FALSE) %>% mutate(plant_num = as.factor(plant_num), sulfur_condition= fct_relevel(sulfur_condition, "SS", "SD"), genotype = as.factor(genotype), genotype=fct_relevel(genotype, "WT1", "W78*", "WT2", "E568K"), # warning is 8 compartment = as.factor(compartment), anion = as.factor(anion)) %>% filter(sulfur_condition == "SD") %>% dplyr::rename(number_tube = `n°tube`) %>% mutate(plant_num_tube = paste0(plant_num, "_", number_tube))write_csv(df_anion, file = here::here("data/metabolomic/output/anion_EVA.csv"))all_possibility <- df_anion %>% distinct(anion,compartment)# Initialisation de la liste qui va stocker tous les plotsplots <- list()# Boucle sur chaque combinaisonfor (i in seq_len(nrow(all_possibility))) { anion_i <- all_possibility$anion[i] compartment_i <- all_possibility$compartment[i] # Filtrage des données pour la combinaison courante df_select <- df_anion %>% filter( anion == anion_i, compartment == compartment_i ) %>% drop_na(concentration) %>% as.data.frame() # Si aucune donnée n'est disponible, on passe à la combinaison suivante if(nrow(df_select) == 0) { message("Aucune donnée pour: ", anion_i, ", ", compartment_i) next } # Définition de l'étiquette de l'axe des ordonnées ylab_i <- paste0("% of ", anion_i, " in ", compartment_i) # Essayer d'exécuter stat_analyse et capturer les erreurs éventuelles res <- tryCatch({ stat_analyse( data = df_select, column_value = "concentration", category_variables = c("genotype"), grp_var = "", show_plot = TRUE, outlier_show = FALSE, label_outlier = "plant_num_tube", biologist_stats = TRUE, Ylab_i = ylab_i, control_conditions = "", strip_normale = FALSE, hex_pallet = mutant_palette ) }, error = function(e) { message("Erreur pour: ", anion_i, ", ", compartment_i, " -> ", e$message) return(NULL) }) # Si une erreur s'est produite, on passe à l'itération suivante if(is.null(res)) next # Extraction du plot et ajout des labels pour la légende p_plot <- res[["plot"]] + labs(color = "Genotype", fill = "Genotype") plot_name <- paste0(anion_i, "_", compartment_i) fig_export(here::here(paste0("report/metabolomic/plot/anion_EVA_2015/stats_plot/", plot_name)), p_plot, height_i = 4, width_i = 5, res_i = 300,format = "png") plots[[plot_name]] <- p_plot}# Assemblage de tous les plots avec patchworkfinal_plot <- wrap_plots(plots, ncol = 3) + plot_layout(guides = "collect") + plot_annotation() & theme(legend.position = 'bottom')# Affichage du plot finalprint(final_plot)fig_export(here::here("report/metabolomic/plot/anion_EVA_2015/stats_plot/merge_sulfate_nitrate"), final_plot, height_i = 8, width_i = 12, res_i = 300, format = "png")```